
The average Richmond upon Thames home sold for £788,872 in May 2026, down 2.5% in a year. Ward medians and by-type prices from 1,737 Land Registry sales.
Richmond upon Thames is one of the most expensive boroughs in London to buy in, and it is also one of the few where prices have been falling. This page sets out what homes in the borough are actually selling for, using the two official records: the UK House Price Index, which is the borough-wide average, and HM Land Registry’s Price Paid data, which is every individual completed sale. Asking prices in agents’ windows are not in here.
The headline figure
The average home in Richmond upon Thames sold for £788,872 in May 2026, the most recent month published in the UK House Price Index. That is down 2.5% over twelve months and down 0.7% on the month before.
Two things are worth holding on to. The first is that the fall is real but modest: the borough index stands at 101.0, so prices are still slightly above where they were at the start of 2023. The second is that Richmond is falling more slowly than London as a whole, where the average was £544,814 in May 2026, down 3.7% over the year. England, by contrast, rose 2.3% to £292,095. The gap between London and the rest of the country is closing, and Richmond is part of that.
Prices by property type
The borough average hides an enormous spread, because Richmond contains both £10 million villas on Castelnau in Barnes and one-bedroom flats behind Twickenham station. These are the May 2026 borough averages from the UK House Price Index, with the twelve-month change:
- Detached: £1,731,524, down 2.4% over the year.
- Semi-detached: £1,159,624, down 1.4%.
- Terraced: £898,002, down 1.3%.
- Flats and maisonettes: £483,336, down 4.1%.
Flats are taking the heaviest hit, which is the pattern across London. Flat buyers are the most exposed to mortgage rates, and in this borough they are also competing with a rental market that has absorbed a lot of would-be first-time buyers. A first-time buyer in Richmond paid an average of £629,506 in May 2026, down 2.6% on the year. Someone who already owned and was moving paid £943,756.
What homes actually sold for, ward by ward
The index is a modelled average. To show what people really paid and where, we pulled every Land Registry Price Paid record for the borough for the twelve months to July 2026: 1,884 sales, of which 1,737 were standard market transactions in the four residential property types. The other 147 records are what the Land Registry calls additional price paid transactions, which include repossessions, part-share purchases and portfolio deals, and it advises against using them for market analysis, so they are excluded here. Every postcode in the set was checked against the postcodes.io lookup and all 1,239 of them sit inside Richmond upon Thames, so nothing from Hounslow, Kingston or Wandsworth has crept in.
The median sale across the borough was £705,000. Medians are used rather than averages here because a single Castelnau sale at £10 million would otherwise distort a whole ward.
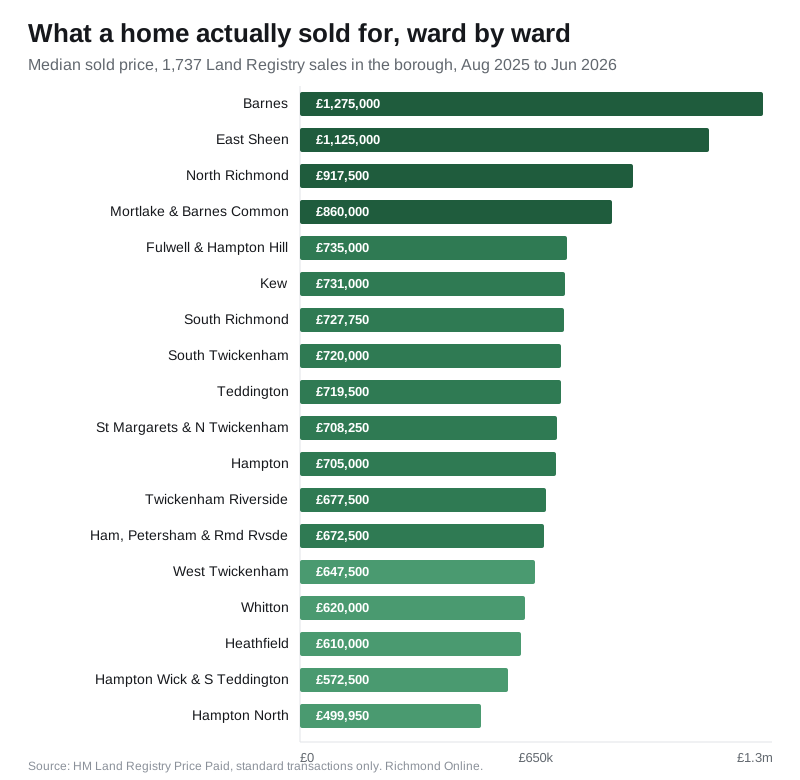
The spread is the story. Barnes at £1,275,000 is two and a half times Hampton North at £499,950, and both are in the same borough, paying the same council, on the same council tax banding system. The river is roughly the dividing line: the four most expensive wards (Barnes, East Sheen, North Richmond, Mortlake and Barnes Common) are all on the Surrey-facing south bank, while the four cheapest (Hampton North, Hampton Wick and South Teddington, Heathfield, Whitton) are all in the Middlesex half of the borough, further from a fast train and further from a park gate.
Median by property type across the same 1,737 sales:
| Property type | Sales | Median price |
|---|---|---|
| Detached | 100 | £1,432,500 |
| Semi-detached | 346 | £940,000 |
| Terraced | 626 | £882,250 |
| Flat or maisonette | 665 | £470,000 |
Note how close terraced and semi-detached medians are, £882,250 against £940,000. In much of the country a semi is a clear step up from a terrace. In Richmond, where the Victorian terraces of Kew, St Margarets and North Richmond are large and sit in the best-connected streets, the two categories overlap almost completely.
How Richmond compares
| Area | Average price | Annual change |
|---|---|---|
| Richmond upon Thames | £788,872 | −2.5% |
| Wandsworth | £659,547 | −6.1% |
| Kingston upon Thames | £582,403 | 0.0% |
| London | £544,814 | −3.7% |
| Hounslow | £501,326 | −2.4% |
| England | £292,095 | +2.3% |
Richmond is the most expensive of its immediate neighbours and sits at roughly 2.7 times the England average. The comparison worth watching is Kingston, one bridge away, where prices were flat over the year rather than falling. Wandsworth, on the other side, fell more than twice as fast as Richmond.
What this means if you are buying or selling
If you are selling, a falling market rewards realistic pricing. The borough average is down 2.5% and flats are down 4.1%, so a valuation based on what a neighbour got in 2023 will sit. If you are buying, you have more negotiating room than at any point since 2022, and the widest choice is in flats, which are both the cheapest category and the fastest falling. If you are staying put, a 2.5% paper fall on an £800,000 home is about £20,000, which matters on paper and not much in practice unless you are remortgaging near the edge of a loan-to-value band.
Whichever you are, two running costs are worth checking before the asking price gets all the attention. The first is what is being built nearby, which the Richmond planning news page covers. The second is the rail fare from your nearest station: the gap between a zone 3 and a zone 6 annual Travelcard is £1,164 a year, which over a 25-year mortgage is real money attached to an address rather than a house.
Frequently asked questions
What is the average house price in Richmond upon Thames?
£788,872 in May 2026, according to the UK House Price Index, which is built from completed HM Land Registry sales. That is down 2.5% on the year.
Are Richmond house prices going up or down?
Down. The borough fell 2.5% in the twelve months to May 2026 and 0.7% in the month. Flats fell hardest at 4.1%. London as a whole fell 3.7% over the same period, so Richmond is falling, but more slowly than the city around it.
Which is the most expensive part of Richmond upon Thames?
Barnes, with a median sold price of £1,275,000 across 83 sales in the year to July 2026, followed by East Sheen at £1,125,000. The single highest price in that year was £10 million for a detached house on Castelnau, SW13.
Where are the cheapest homes in the borough?
Hampton North, median £499,950, then Hampton Wick and South Teddington at £572,500 and Heathfield at £610,000. All three are on the Middlesex side of the borough.
How much is a flat in Richmond?
The borough average was £483,336 in May 2026 and the median flat actually sold for £470,000 in the year to July 2026, across 665 sales. Flats are the largest single category of sale in the borough.
How can I check what a specific house sold for?
Every completed sale in England and Wales is public. Search a street or address for free on HM Land Registry Price Paid.
Sources
- UK House Price Index, Richmond upon Thames (ONS and HM Land Registry) for the borough average, property-type and buyer-type figures.
- HM Land Registry Price Paid linked data for the 1,884 individual sale records behind the ward and median figures, filtered to standard transactions in the four residential property types.
- postcodes.io to confirm every sale postcode falls inside the borough and to assign each sale to a ward.
- HM Land Registry Price Paid search to look up any individual address.
UK House Price Index figures are provisional and revised as more sales complete. Land Registry sale records lag completion by several weeks, so the most recent month is always incomplete. Confirm the latest numbers against the linked sources before making a decision.
Have your say